
THE BEGINNING.
MAKING SOUND VISIBLE
Seeing Sound by PETRU
BEFORE VISUALISERS: THE FIRST SIGNS OF SOUND
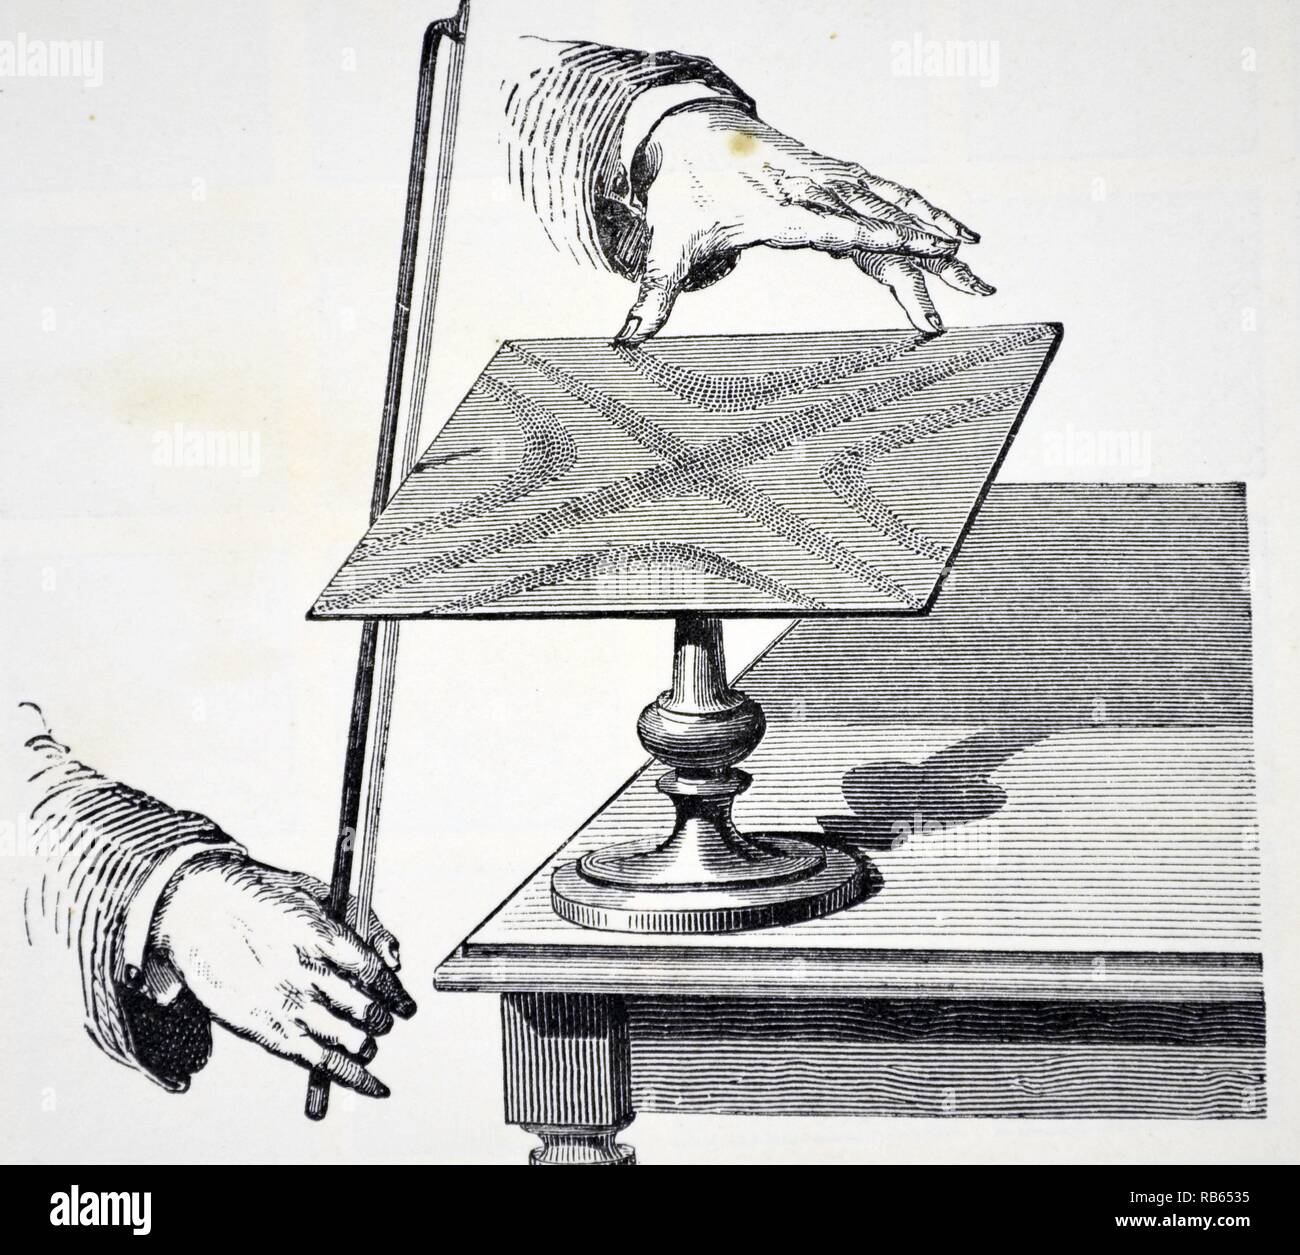
Before visualisers existed, scientists were already searching for ways to make sound visible. In 1787, Ernst Chladni revealed vibration patterns by sprinkling sand onto metal plates and setting them into motion, forming intricate shapes now known as Chladni figures. These experiments proved that sound isn’t just something we hear - it has structure and form.
Building on this foundation, the 19th century introduced new tools to study sound more precisely. The Helmholtz resonator, developed by Hermann von Helmholtz, allowed scientists to isolate and measure specific frequencies within complex sounds. Together, these discoveries revealed how sound behaves through motion and vibration, transforming it from an invisible phenomenon into something that could be both seen and scientifically understood.
The Middle: From Science to Patterns
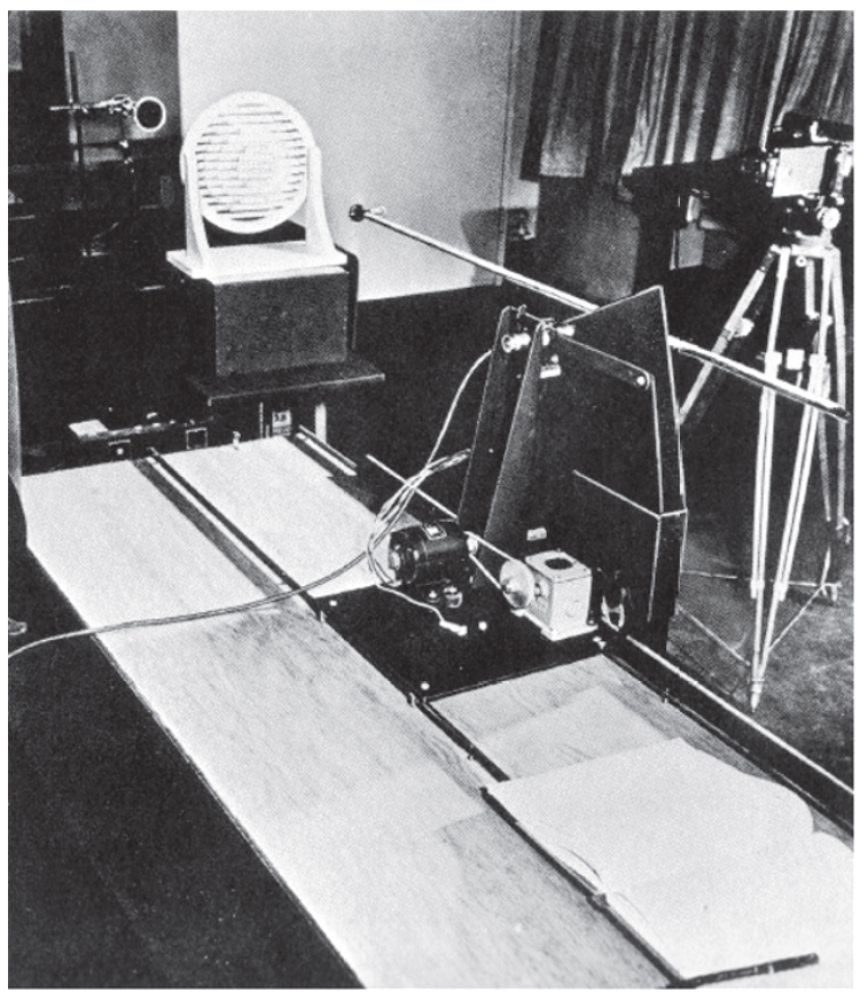
In the 20th century, sound visualization became more precise and expressive. Techniques such as shadowgraphy and Schlieren imaging made it possible to capture sound waves as they moved through air, revealing pressure changes and wave patterns that were once impossible to observe directly. As technology advanced, sound visualization moved beyond purely scientific measurement. What began as a tool for analysis gradually evolved into a medium for exploration - where sound could be understood not only as structure, but also experienced as a form of visual expression and art.
THE TURNING POINT. From Sound to Screen
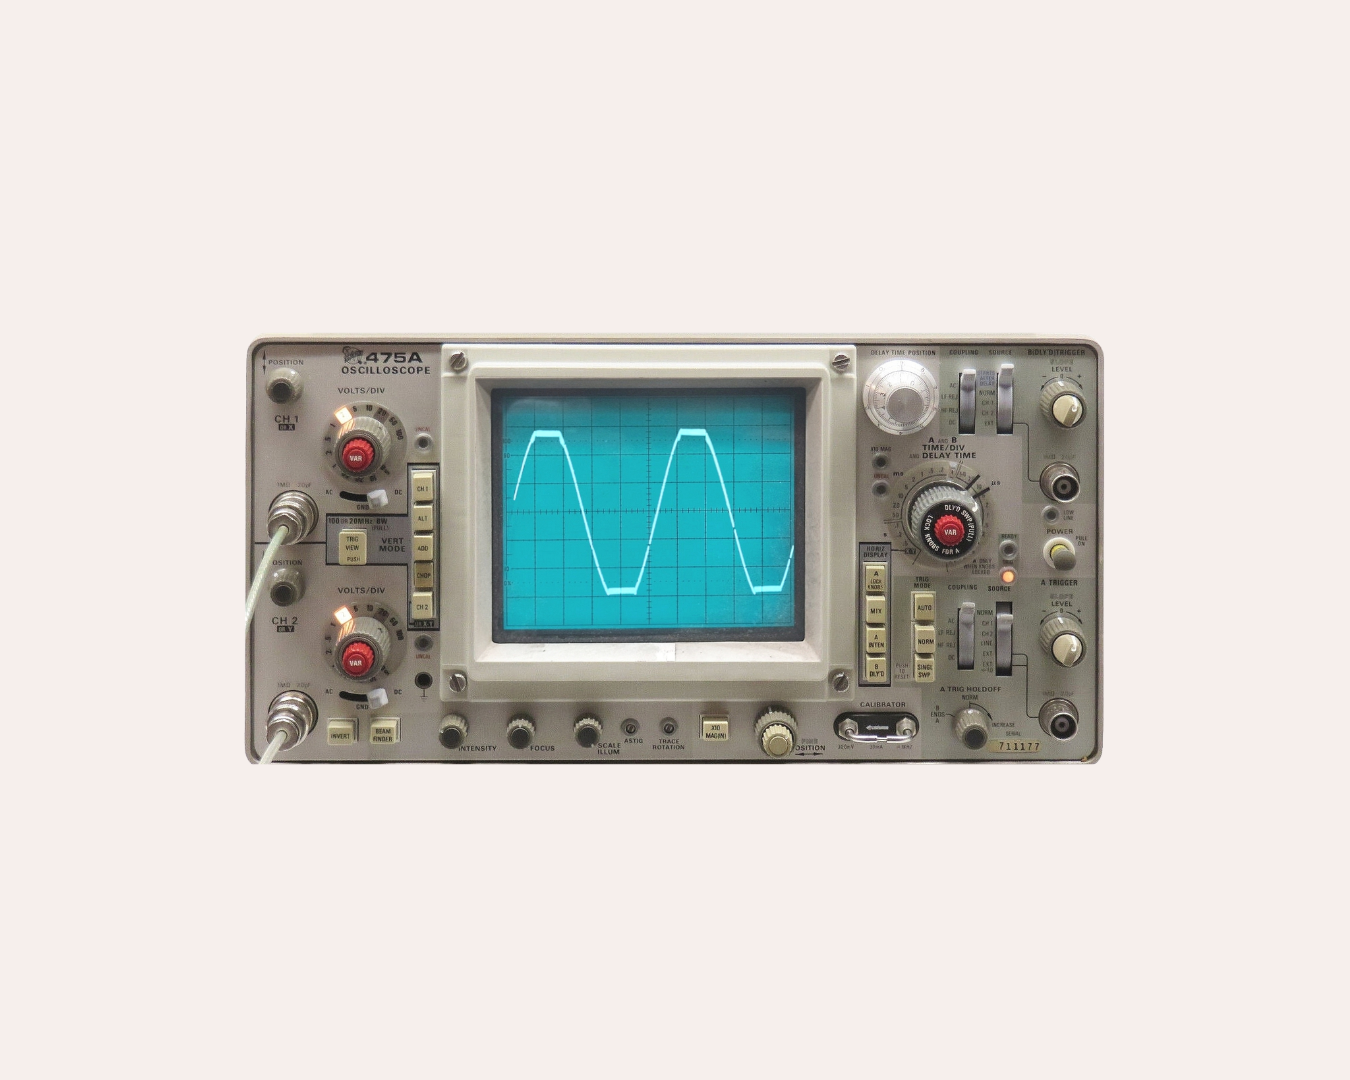
By the late 20th century, sound was fully integrated into electronic systems, transforming how it could be analyzed and experienced. With the rise of digital signal processing and tools like the oscilloscope, audio signals could be precisely measured, displayed, and translated into dynamic visual forms on screens in real time. Complex waveforms, frequencies, and amplitudes were no longer abstract concepts - they became something you could observe and study directly.
As computing power advanced, these visualizations moved beyond laboratories and into music production, media, and everyday technology. Spectrum analyzers, waveform displays, and early digital interfaces allowed sound to be interpreted visually with increasing clarity and creativity. Music could now be watched - not just heard - bridging the gap between science, technology, and artistic expression.
THE PRESENT. Seeing Sound Today
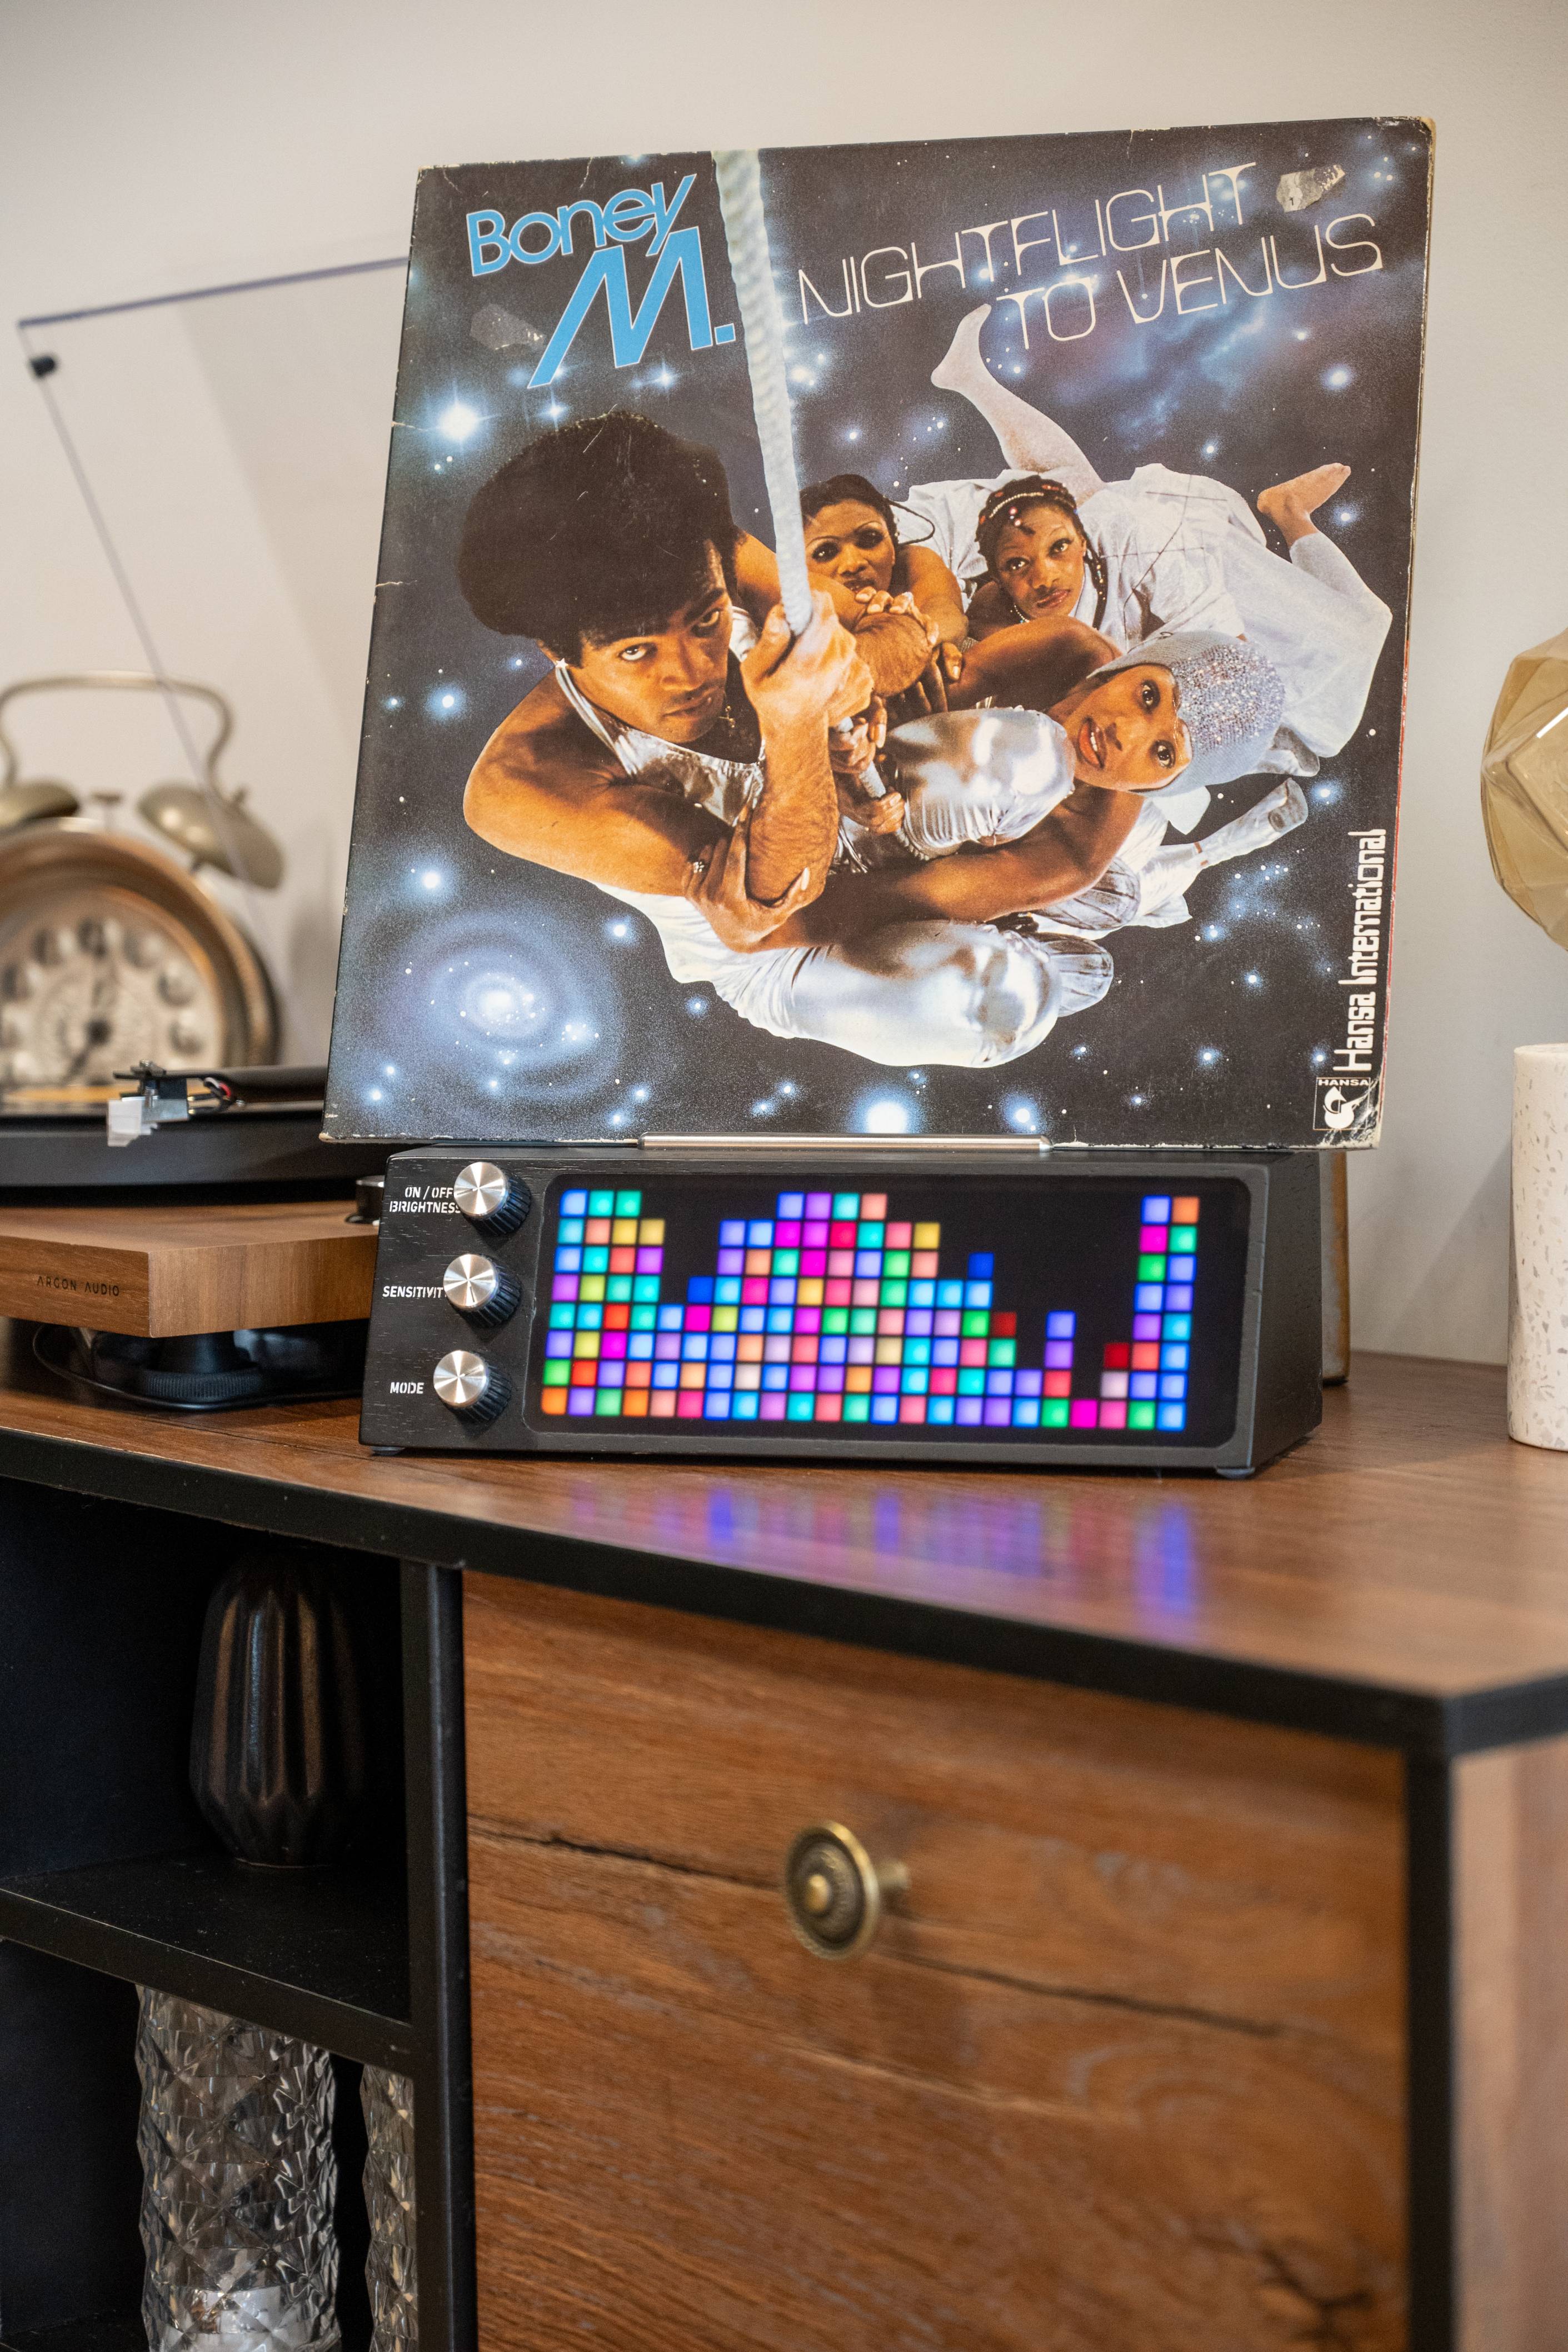
Today, sound is no longer just heard - it’s experienced. Music shapes motion, light, and atmosphere in real time, transforming spaces into something immersive and alive. What once existed only as vibration in the air now becomes a dynamic presence that surrounds you, responding instantly and turning sound into something physical and engaging.
Advancements in technology have made it possible to translate audio into movement and light with incredible precision, allowing every beat, rhythm, and frequency to take on a visual form. This creates a deeper connection to music - one that goes beyond listening and into feeling, seeing, and experiencing it as a whole.
At PETRU, we bring this experience into everyday life. Our visualiser transforms sound into motion and light, where rhythm becomes something you can see and feel. It’s not just about playing music- it’s about giving it presence, turning every track into an atmosphere that lives and moves with you.
REFERENCE
Dirk Ullmann (2007). Chladni figures and the visualization of sound.
David Fernández Comesaña (2014). Sound visualization and acoustic analysis techniques.